
Draw Bar / Graph
Plot graph or bar chart from array of number.
Node Data | |
|---|---|
 | |
Display name | |
Draw Bar / Graph | |
Internal name | |
Node_Plot_Linear | |
Inheritances | |
| Node_Processor | |
| Node_Plot_Linear | |
Inputs | |
vec2 |
Dimension |
Data | |
float |
Data |
float |
Value Offset |
bool |
Flip Value |
enum |
Trim Mode |
range |
Range |
float |
Sample Frequency |
int |
Window Size |
float |
Window Offset |
Plot | |
enum |
Type |
vec2 |
Origin |
rotation |
Direction |
path |
Path |
float |
Scale |
float |
Radius |
bool |
Loop |
slider |
Smooth |
bool |
Clockwise |
Shape | |
float |
Graph Thickness |
float |
Bar Width |
float |
Spacing |
bool |
Rounded Bar |
float |
Exploded |
slider |
Donut Radius |
float |
Donut Separation |
Color | |
color |
Base Color |
gradient |
Color Over Sample |
gradient |
Color Over Value |
range |
Value Range |
bool |
Absolute |
Background | |
bool |
Background |
color |
Background Color |
Outputs | |
surface |
Surface Out |
Attributes | |
| Color Depth | |
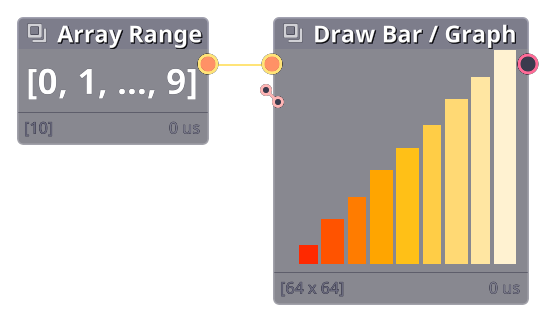
Bar/Graph node is used to plot graph using array of number. While initialliy created for audio visualization, it can be use to create interesting shape as well.
Data Processing
| Value Offset | Add or subtract all values with a fixed amount. |
| Flip Value | Invert the sign of the data. |
| Trim Mode | Set the data trimming mode. |
| Range | Range of the data trimming. |
| Sample Frequency | Sample data at every N values instead of all values. |
Plot Properties
| Type | Set the type of plot. |
| Origin | The origin position. |
| Direction | The direction where each subsequence data go. |
| Path | The path to draw the plot on. If using path, the Direction property will be disabled. |
| Scale | The scale of the plot. |
The graph type open up to more controls:
| Loop | Add line connecting the last and first data. |
| Smooth | Smooth out the value with moving average. |
Render Properties
Properties in this section are all related to rendering.
| Base Color | Base color of the plot |
| Color Over Sample | Color to blend per each value (based on the index) |
| Color Over Value | Color to blend based on the value |
| Value Range | The range for the Color Over Value property. e.g. if the range is [0, 10] then value 5 will correspond to the middle of the gradient |
| Absolute | Apply absolute to the value before calculating Color Over Value |
| Bar Width | The width of each bar |
| Rounded Bar | Use capsule bar shape instead of rectangle |
| Graph Thickness | The thickness of the graph line |
| Spacing | The distance between each data point |
| Background | Background Color |
Commit History
| 1.14.4 |
|
|---|